|
|
|
|
|
LSY-10041 Veterinary Drug residue Diagnostic Phenylethanolamine A ELISA Detection Kit
Product Details:
Payment & Shipping Terms:
|

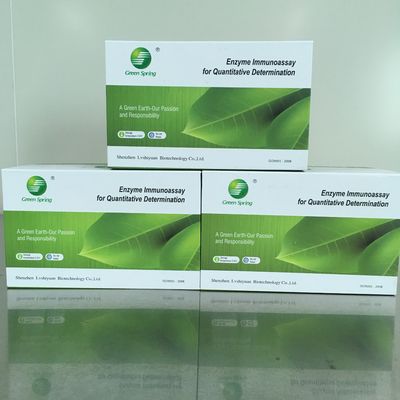
Detailed Product Description
| Sensitivity: | 0.1 Ppb | Incubator Temperature: | 25℃ |
|---|---|---|---|
| Incubator Time: | 30min~15min | Sample Performance: | Tissue, Feed |
| Specification: | 96 Wells/kit | MOQ: | 1 Kit |
| Shelf Life: | 12 Months | Recovery Rate: | 85±25% |
| Highlight: | veterinary diagnostic elisa kits,Phenylethanolamine A elisa test,drug residue assay kit |
||
Phenylethanolamine A ELISA Test Kit(Tissue, feed)
Catalog No. LSY-10040
1. Principle
The test kit is based on the competitive enzyme immunoassay for the detection of Phenylethanolamine A in the sample. The conjugated antigen is pre-coated on the micro-well stripes. The Phenylethanolamine A in the sample and the coupling antigens pre-coated on the micro-well stripes compete for anti- Phenylethanolamine A antibodies. After the addition of the enzyme conjugate, the TMB substrate is added for coloration. The optical density (OD) value of the sample has a negative correlation with the Phenylethanolamine A concentration in the sample. The value is compared to the standard curve and the Phenylethanolamine A concentration is subsequently obtained.
2. Technical specifications
Sensitivity: 0.1 ppb
Incubator temperature: 25℃
Incubator time: 30min~15min
Detection limit
Tissue 0.2 ppb
Feed 0.5 ppb
Cross-reactions
Phenylethanolamine A 100%
Ractopamine <1%
Salbutamol <1%
Clenbuterol <1%
Recovery rate
Tissue, feed 85±25%
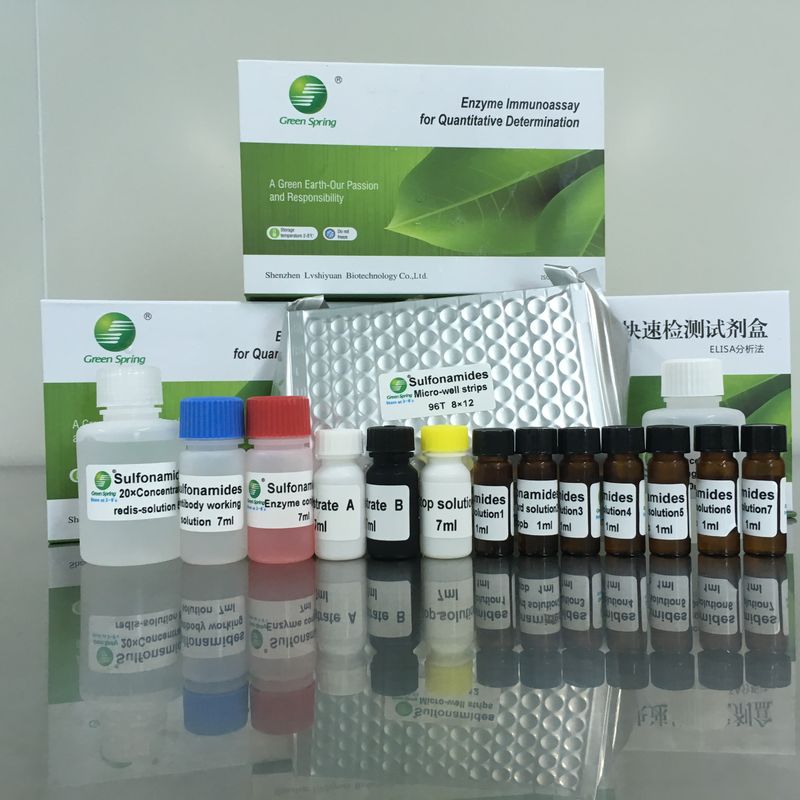
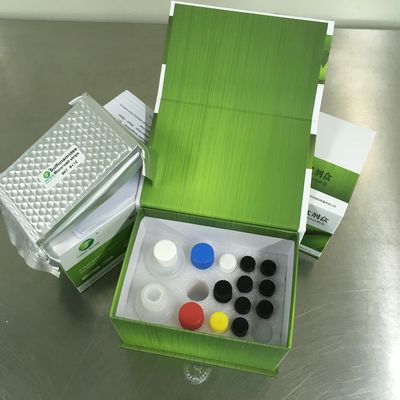
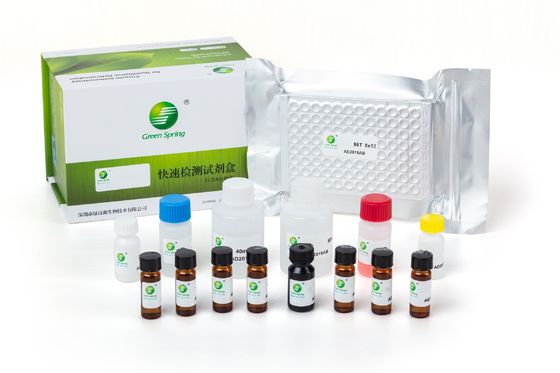
3. Components
| 1 | Micro-well strips |
12 strips with 8 removable wells each |
|
| 2 | 6× standard solution (1mL each) | 0ppb | 0.1ppb |
| 0.3ppb | 0.9ppb | ||
| 2.7ppb | 8.1ppb | ||
| 3 | Enzyme conjugate | 7ml | red cap |
| 4 | Antibody working solution | 7ml | blue cap |
| 5 | Substrate A | 7ml | white cap |
| 6 | Substrate B | 7ml | black cap |
| 7 | Stop solution | 7ml | yellow cap |
| 8 | 20× concentrated washing buffer | 40ml | white cap |
| 9 | 2× concentrated redissolving solution | 50ml | transparent cap |
4. Materials required but not provided
- Equipments: microplate reader, printer, homogenizer, nitrogen-drying device, oscillator, centrifuge, measuring pipets, balance ( a reciprocal sensibility of 0.01 g), incubator.
- Micropipettors: single-channel 20-200 µL and 100-1000 µL, and multi-channel 30-300 µL;
- Reagents: Ethyl acetate, N-hexane, Glacial acetic acid
5. Sample pre-treatment
Instructions (The following points must be dealt with before the pre-treatment )
- Only the disposable tips can be used for the experiments and the tips must be changed when used for absorbing different reagents;
- Before the experiment, each experimental utensil must be clean and should be re-cleaned if necessary, in order to avoid the contamination that interferes with the experimental results.
Solution preparation before sample pre-treatment:
- Sample extracting solution: take 99ml ethyl acetate, add 1 ml glacial acetic acid, and mix it well.
- Sample redissolving solution: the 2×concentrated redissolving solution is diluted with deionized water at 1:1(1mL concentrated redissolving solution + 1mL deionized water), used for sample redissolving.
Samples preparation
5.1 Feed
- Grind sample, take 1.0±0.05g into a 50ml centrifuge tube;
- Add 10 mL Sample extracting solution, shake with oscillator for 3 min;
- Centrifuge at 4000 r/min at room temperature for 10 min;
- Take 2 ml supernatant, blow to dry with nitrogen or air at 50-60 ℃;
- Add 1 ml N-hexane, then add 1ml Sample redissolving solution, shake for 30s;
- Centrifuge at 4000 r/min at room temperature for 10 min, remove the up-layer organic phase.
- Take 20 µL down-layer for analysis.
Fold of dilution of sample: 5
(Because there is sample disturbance, recommend 2PPB as sample CUT OFF value. )
5.2 Tissue
1.Take homogeneous tissue sample 2.0±0.05g into a 50ml centrifuge tube;
2.Add 8 mL Sample extracting solution, shake with oscillator for 2 min;
3.Centrifuge at 4000 r/min at room temperature for 10 min;
4.Take 2 ml supernatant, blow to dry with nitrogen or air at 50-60 ℃;
5.Add 1 ml N-hexane, then add 1ml Sample redissolving solution, shake for 30s;
6.Centrifuge at 4000 r/min at room temperature for 10 min, remove the up-layer organic phase.
7.Take 20 µL down-layer for analysis.
Fold of dilution of sample: 2
(Because there is sample disturbance, recommend 1PPB as sample CUT OFF value. )
6. ELISA procedures
6.1 Instructions
- Bring all reagents and micro-well strips to the room temperature (20-25 ℃) before use.
- Return all reagents to 2-8 ℃ immediately after use.
- The reproducibility of the ELISA analysis, to a large degree, depends on the consistency of plate washing. The correct operation of plate washing is the key points in the procedures of ELISA.
- For the incubation at constant temperatures, all the samples and reagents must avoid light exposure, and each microplate should be sealed by the cover membrane.
6.2 Operation procedures
- Bring test kit to the room temperature (20-25 ℃) for at least 30 min, note that each liquid reagent must be shaken to mix evenly before use.
- Solution preparation: Dilute the 40ml 20× concentrated washing buffer with deionized water at 1:19 (1 part 20× concentrated washing buffer + 19 parts deionized water), or prepare as quantity needed.
- Put the required micro-well strips into plate frames. Re-sealed the unused microplate, stored at 2-8 ℃, not frozen.
- Numbering: number the micro-wells according to samples and standard solution; each sample and standard solution should be performed in duplicate; record their positions.
- Add 50 µL of the sample or the standard solution into separate duplicate wells; add 50 µL of enzyme conjugate, then add 50 µL of the antibody working solution into each well, seal the microplate with the cover membrane, and incubate at 25 ℃ for 30 min.
- Pour liquid out of microwell, flap to dry on absorbent paper; add 250 µL/well of deionized water, wash for 15-30 seconds, then take out and flap to dry with absorbent paper, repeat 4-5 times.
6 Coloration: add 50 µL of the substrate A solution, 50 µL of the B solution into each well. Mix gently by shaking the plate manually, and incubate at 25 ℃ for 15 min at dark for coloration.
7 Determination: add 50 µL of the stop solution into each well. Mix gently by shaking the plate manually. Set the wavelength of the microplate reader at 450 nm to determine the OD value of every well. (Recommend to read the OD value at the dual-wavelength 450/630 nm within 5 min).
7. Result judgment
There are two methods to judge the results; the first one is the rough judgment, while the second is the quantitative determination. Note that the OD value of the sample has a negative correlation with the Phenylethanolamine A in the sample.
7.1 Qualitative determination
The concentration range (ng/mL) can be obtained form comparing the average OD value of the sample with that of the standard solution. Assuming that the OD value of the sampleⅠ is 0.3, and that of the sampleⅡ is 1.0, the OD value of standard solutions is: 2.243 for 0ppb, 1.866 for 0.1ppb, 1.415 for 0.3ppb, 0.864 for 0.9ppb, 0.413 for 2.7ppb, 0.155 for 8.1ppb, accordingly the concentration range of the sampleⅠ is 0.3 to 0.9ppb, and that of the sampleⅡ is 2.7ppb to 8.1ppb.
7.2 Quantitative determination
The mean values of the absorbance values obtained for the average OD value (B) of the sample and the standard solution divided by the OD value (B0) of the first standard solution (0 standard) and subsequently multiplied by 100%, that is
| Percentage of absorbance value = | B | ×100% |
| B0 |
B—the average OD value of the sample or the standard solution
B0—the average OD value of the 0 ng/mL standard solution
Draw the standard curve with the absorption percentages of the standard solutions and the semilogarithm values of the Phenylethanolamine A standard solutions (ng/mL) as Y- and X-axis, respectively. Read the corresponding concentration of the sample from the standard curve by incorporating its absorption percentage into the standard curve. The resulting value is subsequently multiplied by the corresponding dilution fold, finally obtaining the actual concentration of Phenylethanolamine A in the sample.
Using the professional analyzing software of this kit will be more convenient for the accurate and rapid analysis of a large amount of samples. (Please contact us for this software)
8. Precautions
- The room temperature below 25 ℃ or the temperature of the reagents and the samples being not returned to the room temperature (20-25 ℃) will lead to a lower standard OD value.
- Dryness of the microplate in the washing process will be accompanied by the situations including the non-linear standard curves and the undesirable reproducibility; So continue to next step immediately after washing.
- Mix evenly, wash plate completely, the reproducibility of the ELISA analysis, to a large degree, depends on the consistency of plate washing.
- The stop solution is the 2 M sulfuric acid solution, avoid contacting with skin.
- Do not use the kit exceeding its expiry date. The use of diluted or adulterated reagents from the kits will lead to the changes in the sensitivity and the detecting OD values. Do not exchange the reagents from the kits of different lot numbers to use.
- Put the unused microplate into an auto-sealing bag to re-seal it. The standard substance and the colourless color former is light sensitive, and thus they cannot be directly exposed to the light.
- Discard the colouration solution with any color that indicates the degeneration of this solution. The detecting value of the 0 standard solutin of less than 0.5 (A450 nm< 0.5 ) indicates its degeneration.
- The optimum reaction temperature is 25 ℃, and too high or low temperatures will result in the changes in the detecting sensitivity and OD values.
9. Storage and expiry date
Storage: store at 2-8 ℃, not frozen.
Expiry date: 12 months; date of production is on box.
Note: If the Vacuum package of microplate has leakage, it is still valid to use, do not affect the test result, be relax to use.
![]()
Contact Details
Other Products
-
LSY-10049 Chlortetracyline ELISA test kit Antibiotic detection
-
LSY-10050 Erythromycin ELISA test kit for milk, honey, tissue
-
LSY-10046 MQCA Olaquindox metabolites ELISA Test Kit ISO certificated
-
LSY-10047 Nitroimidazoles ELISA Test Kit for tissue, honey, milk and egg
-
LSY-10047 Nitromidazoly ELISA Test Kit antibiotic residue Food safety
-
LSY-10047 Nitromidazoly ELISA Test Kit Food testing ISO certificated